
September’s global air cargo market lived up to analysts’ expectations, becoming the first month of 2024 not to report double-digit growth due to a strong year-on-year comparison, but demand still rose +9% on last year, according to the latest industry data from Xeneta.
Airlines and freight forwarders now face a ‘fine balancing act’ between protecting customer relationships and being tempted by short-term revenue gains offered by increasing market volatility, including this week’s strikes at ports on the US East Coast and Gulf Coast.
“September is already old news. October is a whole new ballgame,” said Niall van de Wouw, Xeneta’s Chief Airfreight Officer. “We could see rates rising very quickly on some trade lanes because of the fear-of-missing-out (FOMO) effect as air cargo capacity leaves the market for the winter, US port workers go on strike, and conflict is escalating in the Middle East, potentially bringing further Red Sea disruption for ocean freight.”
“I have huge respect for the people who, on a day-to-day basis, are trying to make sense of these challenges and keep the world moving in an efficient manner. How much more can the market take, particularly when there’s so little visibility going forward?
“Reports suggest supply chains could take 4-6 weeks to recover from just a one-week US ports strike, which takes us into November, the busiest month of the year for air cargo volumes. It’s a difficult situation. Covid was worse but this is an accumulation of many events and things can change very quickly. FOMO is a powerful force,” he said.
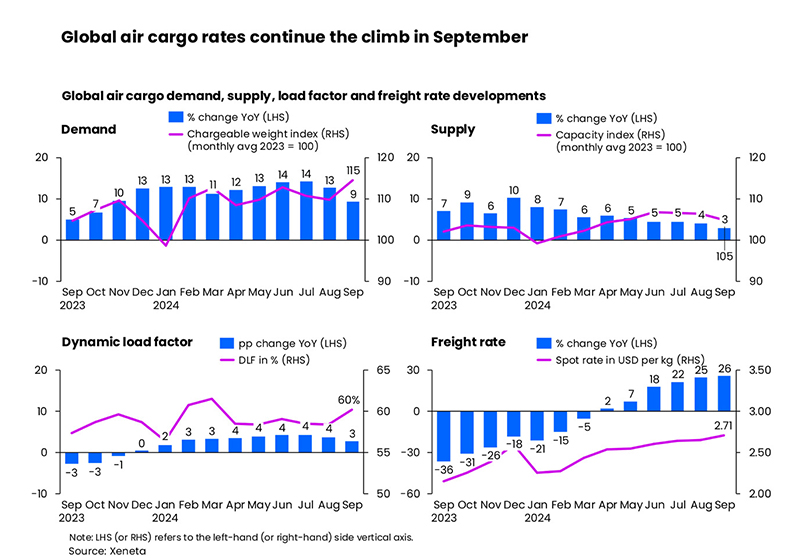
As expected, September’s global air cargo demand growth showed signs of easing a little, up +9% year-on-year, reflecting the strong peak in demand which commenced in September 2023. The latest monthly volumes, however, were sustained by persistent e-commerce demand, ocean-to-air shift due to container shipping disruptions, typhoon disruptions, and a cargo rush ahead of China’s Golden Week holidays (1-7 October).
Global air cargo supply grew by only +3% year-on-year in September - its slowest growth rate this year as airlines began their flight schedule adjustments in preparation for winter. Xeneta expects a 20% reduction in cargo capacity across the Atlantic this winter, to reflect lower passenger demand.
Dynamic load factor - Xeneta’s measurement of capacity utilisation based on volume and weight of cargo flown alongside available capacity - continued to rise due to the persistent imbalance between supply (+3%) and demand (+9%) year-on-year growth. It increased by 3 percentage points year-on-year and 2 percentage points month-on-month, reaching 60% in September.
As a result, September’s average global spot rate increased +26% to USD 2.71 per kg, the fourth straight month of double-digit growth and the highest increase this year. And this occurred against a backdrop of US Gulf Coast Kerosene-Type jet fuel prices showing a -37% year-on-year decline in the same month.
Zooming into the corridor level, spot rates from Asia to North America and Europe topped the chart in September, exceeding the other major global corridors by over two US dollars per kg. Most Asia to North America and Europe rates showed single-digit month-on-month increases in September, except for a slight dip from Southeast Asia to North America. As for year-on-year trends, all registered double-digit growth.
The Middle East and Central Asia to Europe market saw the most striking rise in rates in September. Boosted by continued Red Sea disruptions, this traditional backhaul route saw a +112% year-on-year increase.
As for Europe to North America trade, the spot rate was on par with a month ago but is expected to come under severe upward pressure if US East and Gulf Coasts and Canada port strikes are not resolved quickly. In terms of year-on-year comparison, the corridor showed a +5% increase.
Several backhaul corridors from North America and Europe to Asia showed notable month-on-month spot rate growth: Europe to Southeast Asia (+11%), North America to Northeast Asia (+6%), and North America to Europe (+4%). In terms of year-on-year comparison, the largest decline was observed on the Europe to Northeast Asia trade, which decreased by -11% due to increased trade imbalances.